|
|
| Model | Psychrotolerant Lactobacillus spp. - growth and growth boundary in seafood and meat products |
| References |
Mejlholm, O. and Dalgaard, P. (2007b). Modeling and predicting the growth of lactic acid bacteria in lightly preserved seafood and their inhibiting effect on Listeria monocytogenes J. Food Prot. 70, 2485-2497.
Mejlholm, O, Dalgaard, P. (2013).
Development and
validation of an extensive growth and growth boundary model for
psychrotolerant
Lactobacillus
spp. in seafood and
meat products.
Int. J.
Food Microbiol.
167, 244-260.
|
| Primary growth model | Logistic model with
delay |
| Secondary growth model | Simplified cardinal parameter type model
|
| Environmental parameters in model | Temperature,
atmosphere (CO2), water
phase salt/aw, pH, smoke components/phenol, nitrite and organic
acids in water phase of product (acetic acids, benzoic acid, citric acid, diacetate,
lactic acid and sorbic acids) |
| Product validation studies | Fresh and processed
seafood and meat products (Mejlholm
& Dalgaard 2007b; 2013, 2015). |
| Range of applicability | Temperature (0-25°C),
atmosphere (0-100 % CO2), water phase salt (0.1-6.4 %), pH (5.3-7.7), smoke components/phenol (0-21.2 ppm),
nitrite (0-209 ppm in product), acetic acid (0-12600 ppm in water phase), benzoic acid (0-1800 ppm
in water phase),
citric acid (0-7300 ppm in water phase), diacetate (0-3000 ppm in water
phase), lactic acid (0-67000 ppm in water phase)
and sorbic acid (0-1600 in water phase). |
|
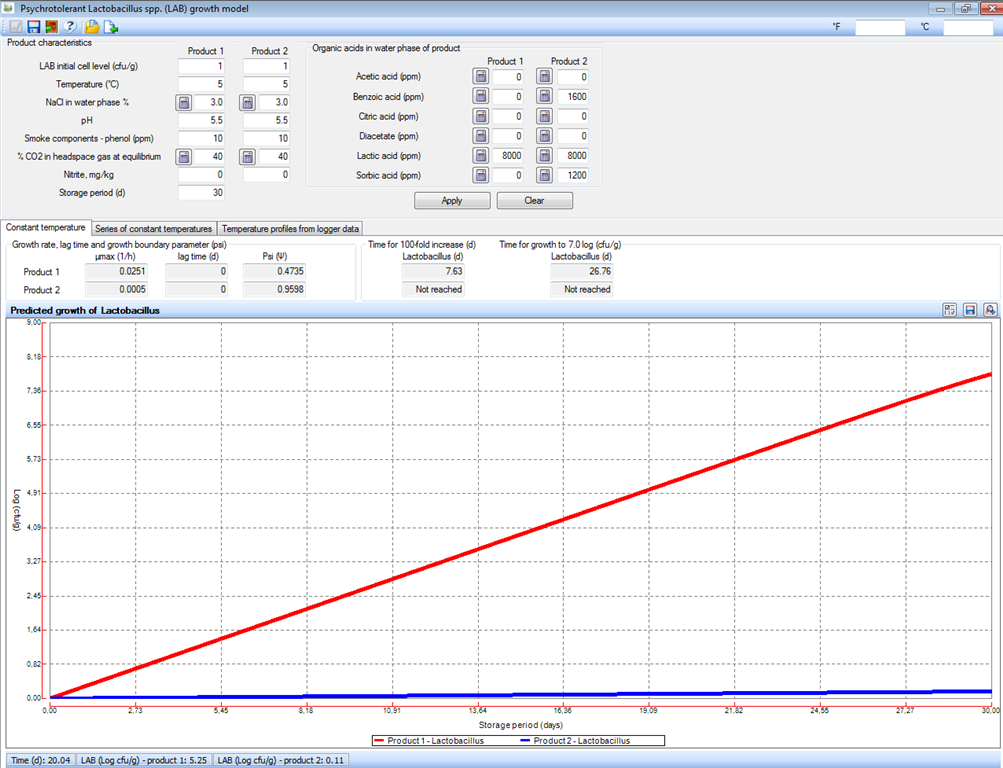
This model includes the effect of 12 environmental parameters (See Table above) on the growth of psychrotolerant Lactobacillus spp. in fresh and processed seafood and meat products. FSSP predicts growth of these psychrotolerant lactic acid bacteria (LAB) without using a lag phase as numerous studies have confirmed their grow without a significant lag time in fresh and lightly preserved seafood and meat products. See the FSSP dialog box and output window below (Fig. 1). |
|
|
|
Fig. 1. The graph above shows how a combination of benzoic and sorbic acid can prevent growth of LAB at 5°C in a product with pH 5.5 (blue curve). FSSP specifically indicates the time needed for the concentrations of LAB to increase 100-fold and to reach 7.0 log (cfu/g) under the selected product characteristics and storage conditions. The concentrations of LAB shown in the bar at the bottom of the output window was obtained by using the mouse to click on the graph at a specific point in time. |
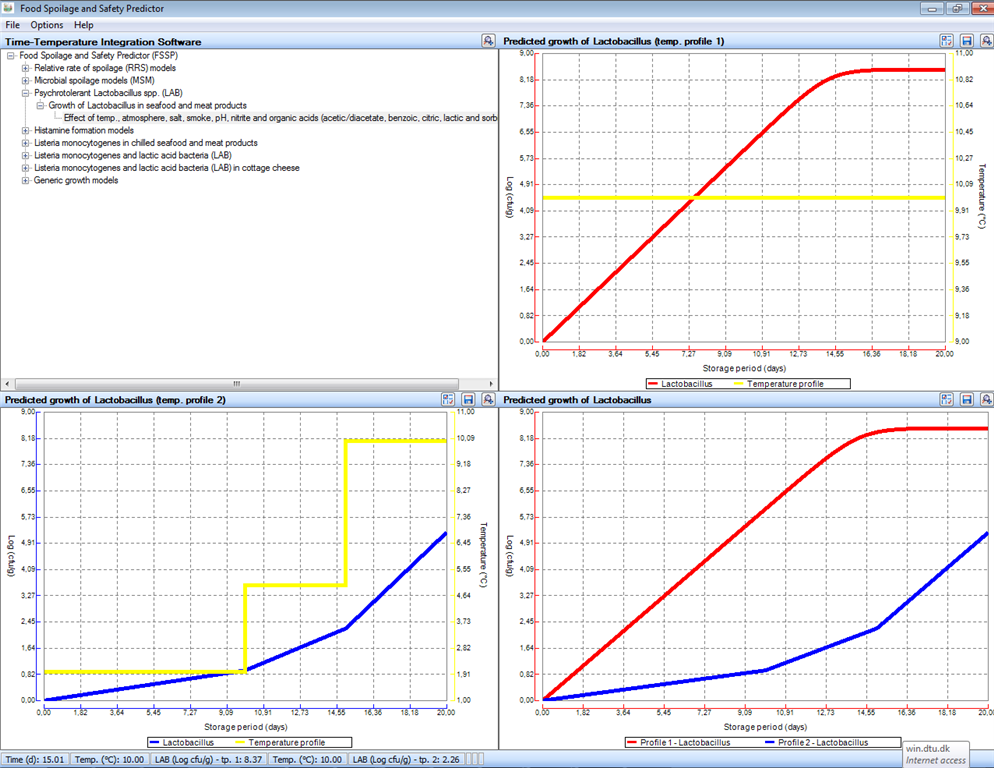
FSSP can predict growth of LAB under changing temperature storage conditions. Simple temperature profiles can be typed in as 'Series of constant temperatures' whereas actual product temperature profiles most often are entered as 'Temperature profiles from data loggers' (Fig. 2).
|
|
|
Fig. 2. Effect of two simple temperature profiles on predicted growth of psychrotolerant Lactobacillus spp. |
|
|
|
|
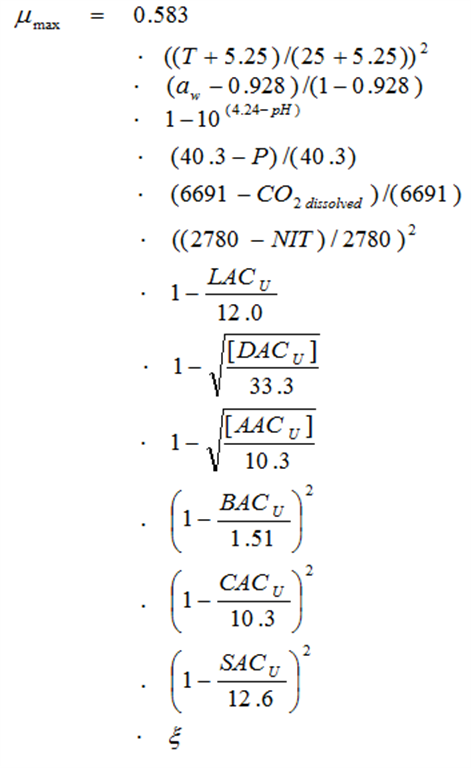
| Eqn. 2. Secondary growth and growth boundary models psychrotolerant lactic acid bacteria | |
|