|
|
| Model | Listeria monocytogenes growth and growth boundary models |
| References | Mejlholm, O. and
Dalgaard, P. (2007a). Modeling and predicting the growth
boundary of Listeria monocytogenes in lightly preserved
seafood. J.
Food Prot. 70, (1) 70-84.
Mejlholm, O. and Dalgaard. P. (2009). Development and validation of an extensive growth and growth boundary model for Listeria monocytogenes in lightly preserved and ready-to-eat shrimp. J. Food Prot. 70 (10), 2132-2143.
Mejlholm, O., Dalgaard, P. (2015). Modelling the
simultaneous growth of Listeria
monocytogenes and lactic acid bacteria in seafood and mayonnaise-based
seafood salads. Food Microbiol.
http://dx.doi.org/10.1016/j.fm.2014.07.005
|
| Primary growth model | Logistic model with delay |
| Secondary growth model | Simplified cardinal parameter type model |
| Environmental parameters in model | Temperature, atmosphere (CO2), water phase salt/aw, pH, smoke components/phenol, nitrite and organic acids in water phase of product (acetic acids, benzoic acid, citric acid, diacetate, lactic acid and sorbic acid) |
| Product validation studies | The model has been extensively validated using data from ready-to-eat food products (Mejlholm & Dalgaard 2007a,b; Mejlholm & Dalgaard, 2009, 2015; Mejlholm et al. 2010, 2014). |
| Range of applicability | Temperature (2-25°C),
atmosphere (0-100 % CO2), water phase salt (0.7-9.0 %), pH (5.6-7.7), smoke components/phenol (0-20 ppm),
nitrite (0-150 ppm in product), acetic acid (0-11000 ppm in water phase), benzoic acid (0-1800 ppm
in water phase),
citric acid (0-6500 ppm in water phase), diacetate (0-3800 ppm in water
phase), lactic acid (0-60000 ppm in water phase)
and sorbic acid (0-1300 in water phase). With mayonaised-based seafood salads the models range of applicability is limited to pH values of 6.0 and above. |
|
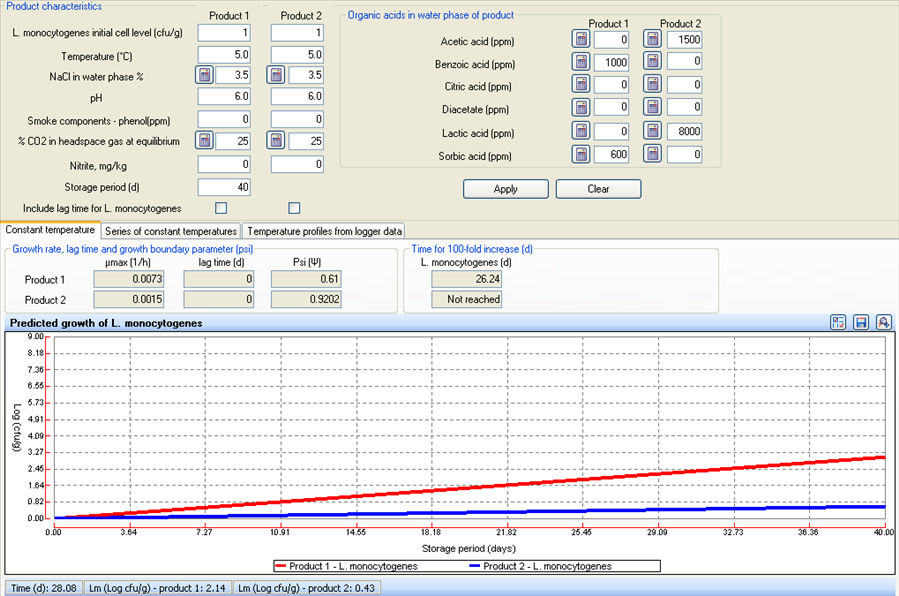
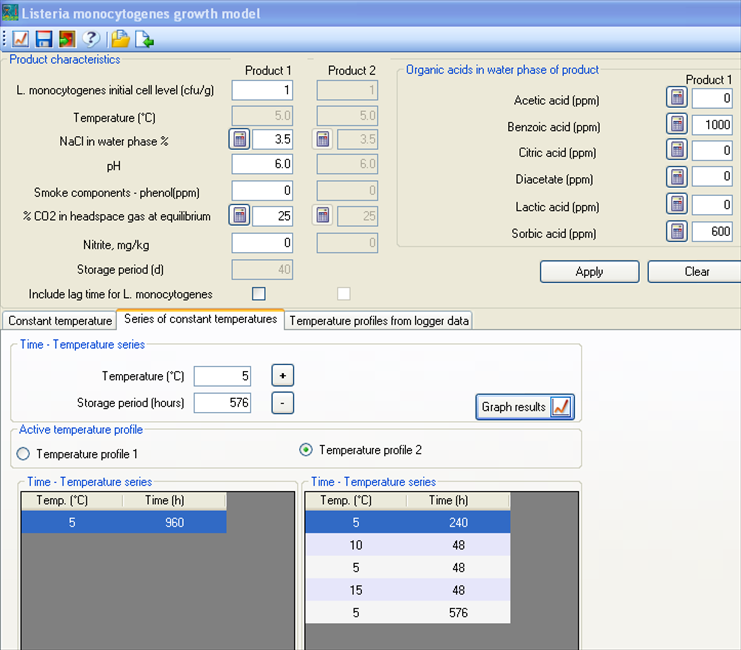
This model includes the effect of 12 environmental parameters (See range of aapplicability above) on growth and on the growth boundary of L. monocytogenes. Information on the lag time of L. monocytogenes in naturally contaminated lightly preserved food is still limited. Therefore, the growth model for L. monocytogenes can be used without lag time (fail safe predictions) or with lag time (more realistic predictions for naturally contaminated products). FSSP uses a relative lag time of 4.5 for L. monocytogenes. See the FSSP dialog box and output window below (Fig. 1). FSSP can predict growth of L. monocytogenes for both constant and changing storage temperatures. Simple temperature profiles can be typed in as 'Series of constant temperatures' whereas actual product temperature profiles most often are entered as 'Temperature profiles from data loggers' (See Fig. 2). |
|
|
|
Fig. 1. Predicted growth of L. monocytogenes. Product 1 is added benzoic acid and sorbic acid whereas product 2 is added acetic acid and lactic acid. Importantly, FSSP can be used to evaluate if one set of food preservatives (like benzoic and sorbic acid) can be replaced with another set of preservatives (like acetic and lactic acid). FSSP predicts the time needed for the concentrations of L. monocytogenes to increase 100-fold under the selected product characteristics and storage conditions. The concentrations of L. monocytogenes shown in the bar at the bottom of the output window was obtained by using the mouse to click on the graph at a specific point in time. |
|
|
|
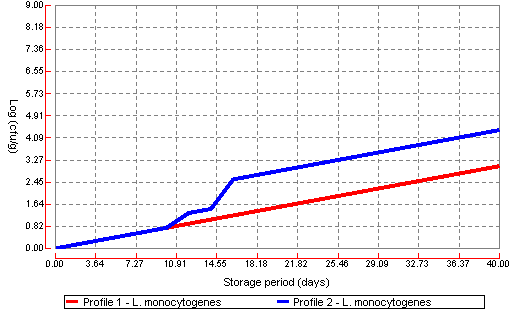
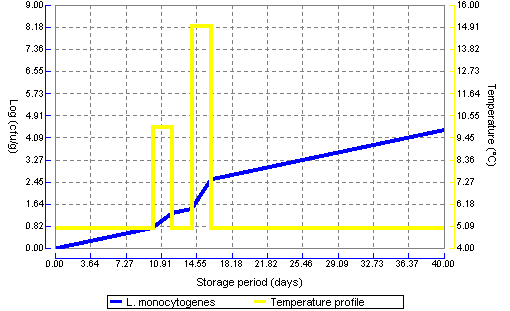
Fig. 2. Predicted growth of L. monocytogenes at a constant storage temperature at 5°C (red curve) compared to growth of L. monocytogenes predicted for a temperature profile including storage at 5°C as well as 48 hours at 10°C and 48 hours at 15°C (blue curve).
|
|
|
|
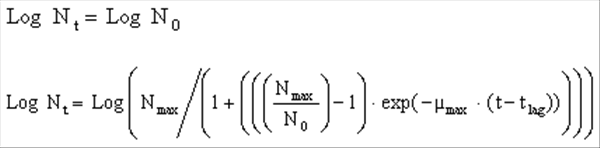
| Eqn. 1. Logistic model with delay (tlag). |
|
|
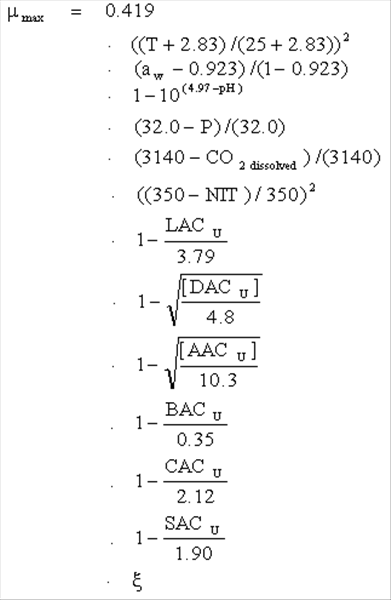
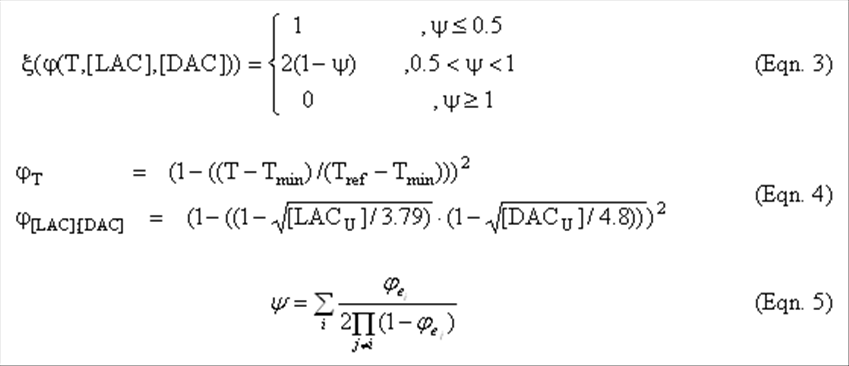
Eqn.
2. Secondary growth and growth boundary models for L. monocytogenes.
|
|
|
|
|
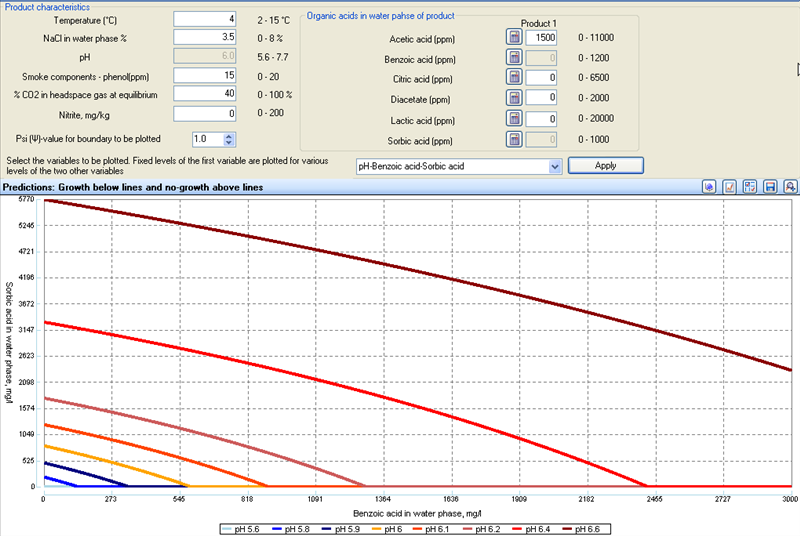
| Fig. 3. Predicted growth boundary (ψ-value = 1.0) of L. monoocytogens at different pH and for different concentrations of sorbic acid and banzoic acid. |
|
|
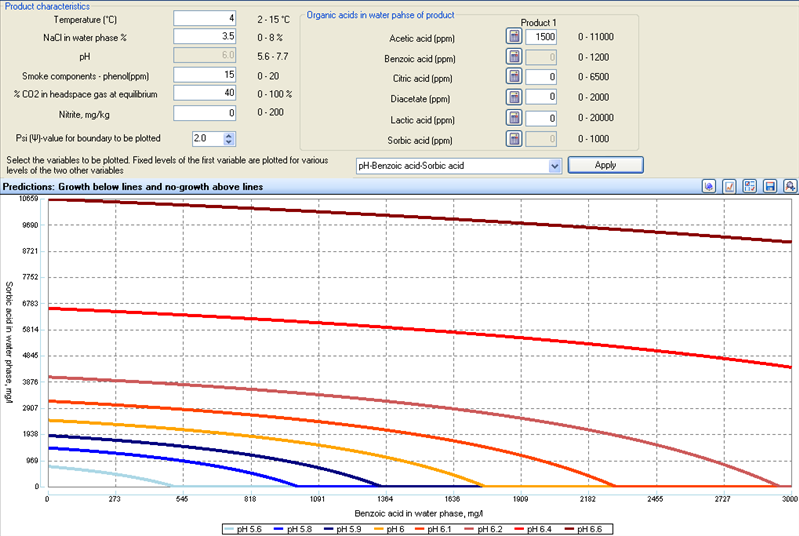
| Fig. 4. Predicted boundary conditions (ψ-value = 2.0) that prevent growth of L. monoocytogens and at the same time are located in a save distance from the growth boundary. |
Importantly, this model has ben shown to accuratelt predict L. monoocytogens growth in naturally contaminated cold-smoked salmon and naturally contaminated cold-smoked Greenland halibut (Mejlholm et al. 2014). With mayonaised-based seafood salads the models renge of applicability is limited to pH of 6.0 and above (Mejlholm and Dalgaard, 2015).
|