|
|
| Module | Microbial spoilage models: Comparison of observed and predicted data |
This module allows data for growth of Photobacterium
phosphoreum and H2S-producing Shewanella bacteria to be compared with
prediction produced by FSSP. The module has been divided into three
sub-modules to handle different types of data:
|
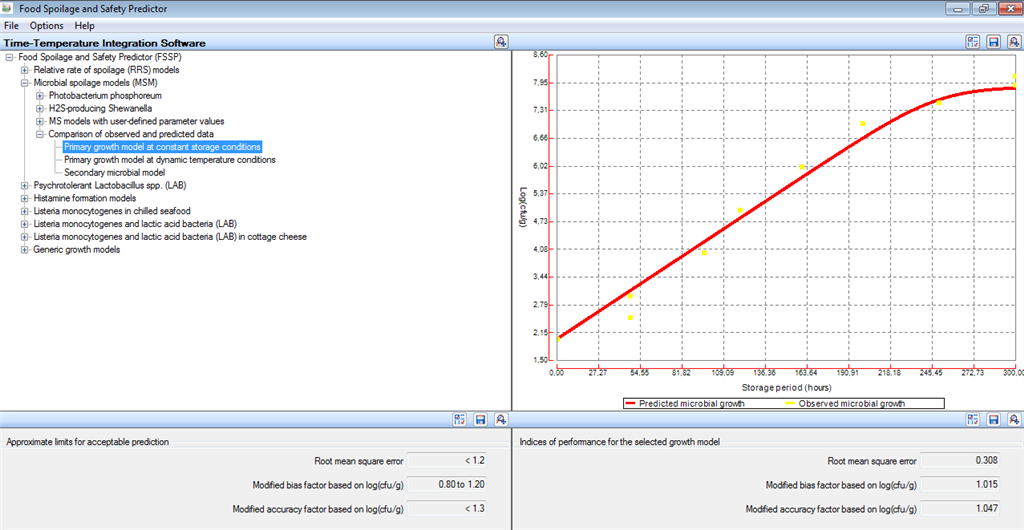
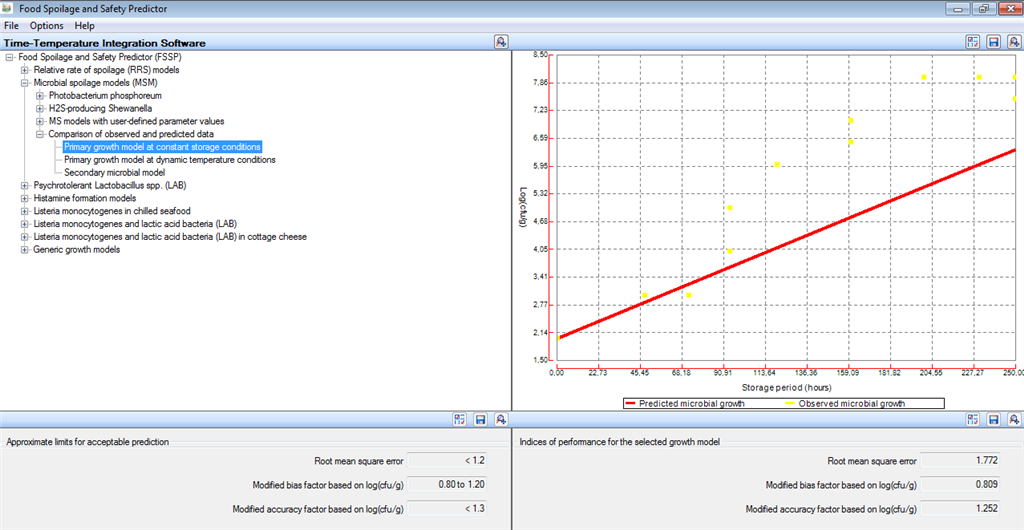
| Primary
growth model at constant storage conditions [FSSP
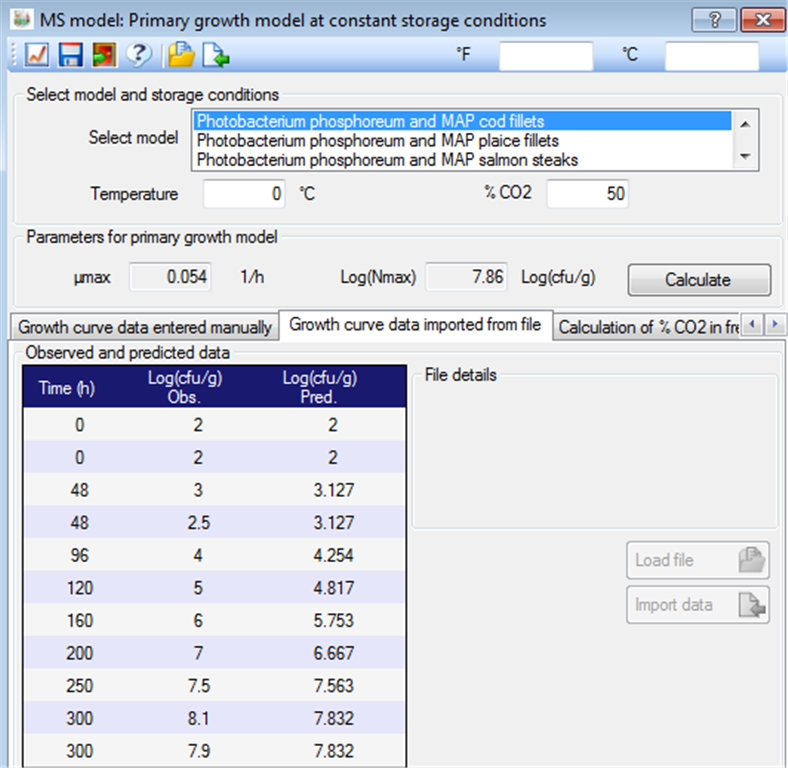
home] Firstly, a microbial spoilage model and appropriate storage conditions must be selected in FSSP to generate the predicted growth. Then data for observed growth of the corresponding bacterium and storage condition can be entered manually or read from ASCII and XML files (See FSSP dialog box below).
By clicking on the graph icon (
|
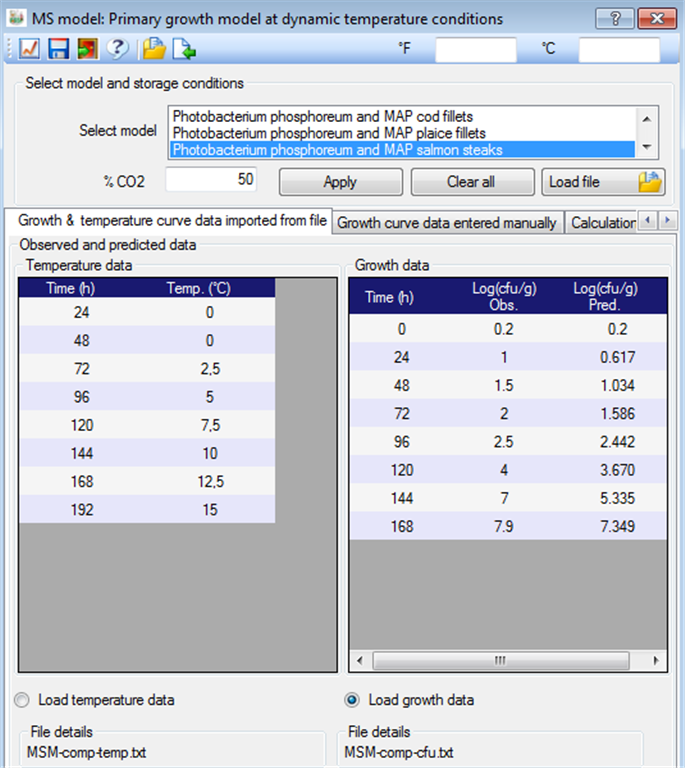
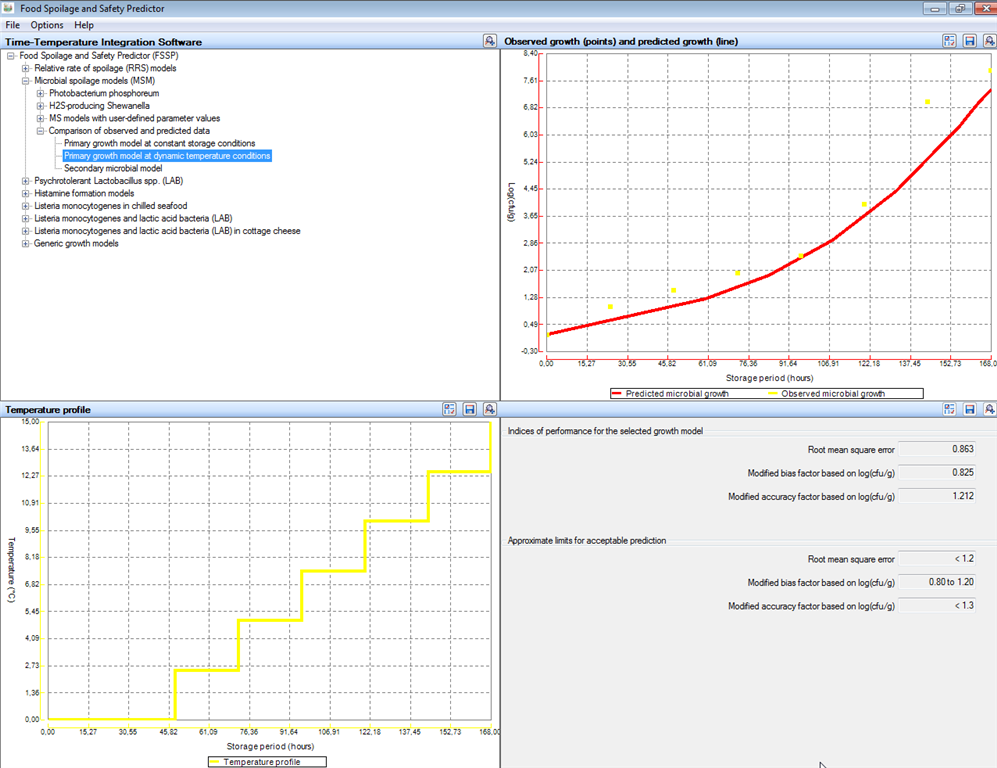
| Primary
growth model at dynamic temperature conditions [FSSP
home]
This FSSP module function in the same way as the module above for Primary growth model at constant storage conditions except that temperature profile data must be imported as ASCII- or XML-files (See dialog box below). The FSSP output window shows (i) the evaluated temperature profile, (ii) observed and predicted growth as well as (iii) indices of model performance.
|
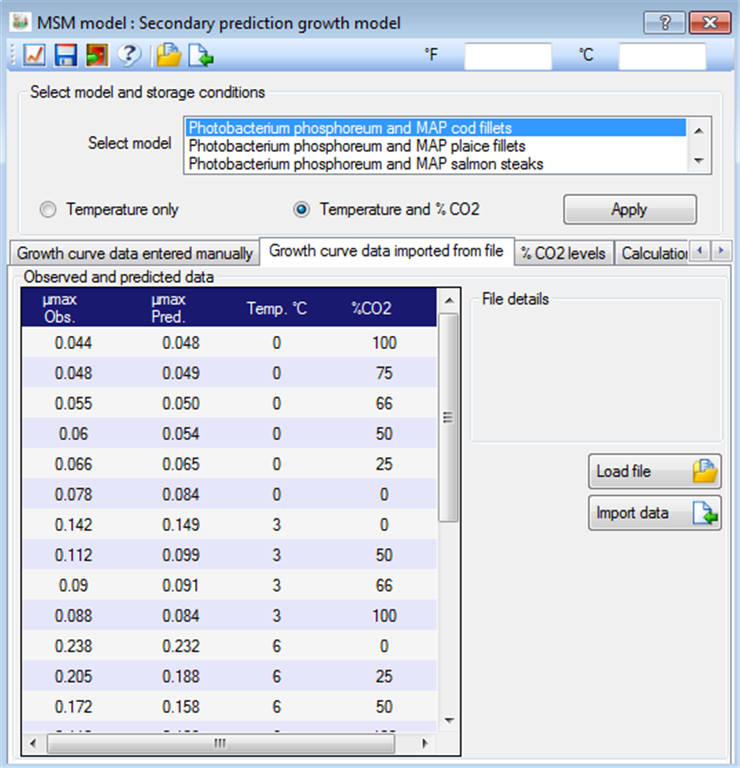
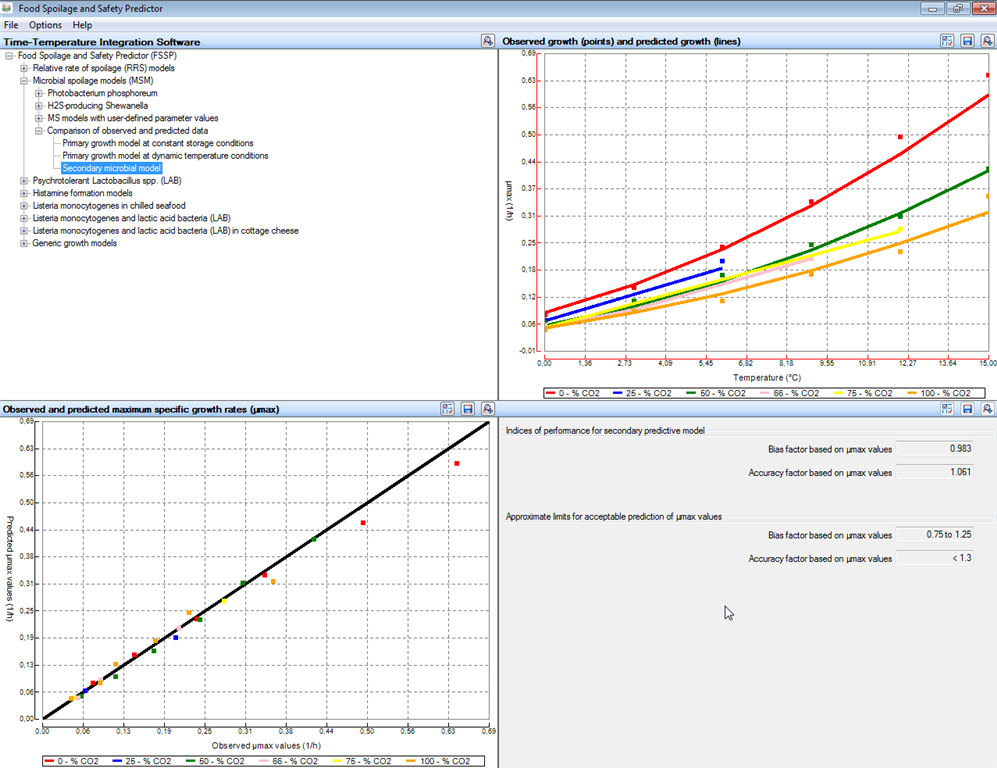
| Secondary microbial
growth models [FSSP home]
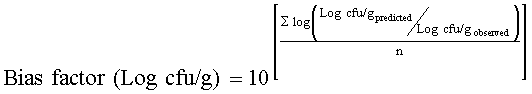
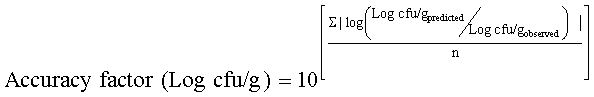
This module function in the same way as the module Primary growth model at constant storage conditions. However, the comparison of observed and predicted data rely on values of maximum specific growth rates (µmax) rather than the concentration of bacteria (Log cfu/g) as used with the primary growth models. Growth rate data must be entered manually or read from an ASCII or XML-file (See dialog box below). FSSP then produces comparison graphs and calculates indices of model performance i.e. (i) the bias factor (Eqn 4) and (ii) the accuracy factor (Eqn 5). The FSSP output window below shows an example with very good agreement between observed and predicted µmax-values.
|