

|
|
| Model | Stochastic model for the simultaneous growth of Listeria monocytogenes and psychrotolerant lactic acid bacteria (LAB) in lightly preserved seafood |
| Primary growth model | Logistic model with delay and including interaction between Listeria monocytogenes and LAB (Giménez and Dalgaard, 2004). |
| Secondary growth model | Simplified cardinal parameter type model. |
| Stochastic model | An existing deterministic model for the simultaneous growth of Listeria monocytogenes and LAB (Mejlholm and Dalgaard, 2015) was expanded into a stochastic model using the Analytica software version 4.3.3.4 (Lumina Decision Systems, Inc., Los Gatos, CA, USA). For each simulation, 10.000 Monte-Carlo repetitions are carried out. |
| Environmental parameters in model | Temperature, atmosphere (CO2), water phase salt/aw, pH, smoke components/phenol, nitrite and organic acids in the water phase of products (acetic acid, benzoic acid, citric acid, diacetate, lactic acid and sorbic acid). |
| Product validation studies | Naturally contaminated samples of cold-smoked and marinated salmon and Greenland halibut (Mejlholm et al. 2014). The current stochastic version of the model has been validated for the following environmental parameters: Temperature, salt (NaCl), pH, phenol, acetic acid and lactic acid. |
Description of the stochastic model for simultaneous growth of Listeria monocytogenes and LAB (stochastic LmLAB-model)
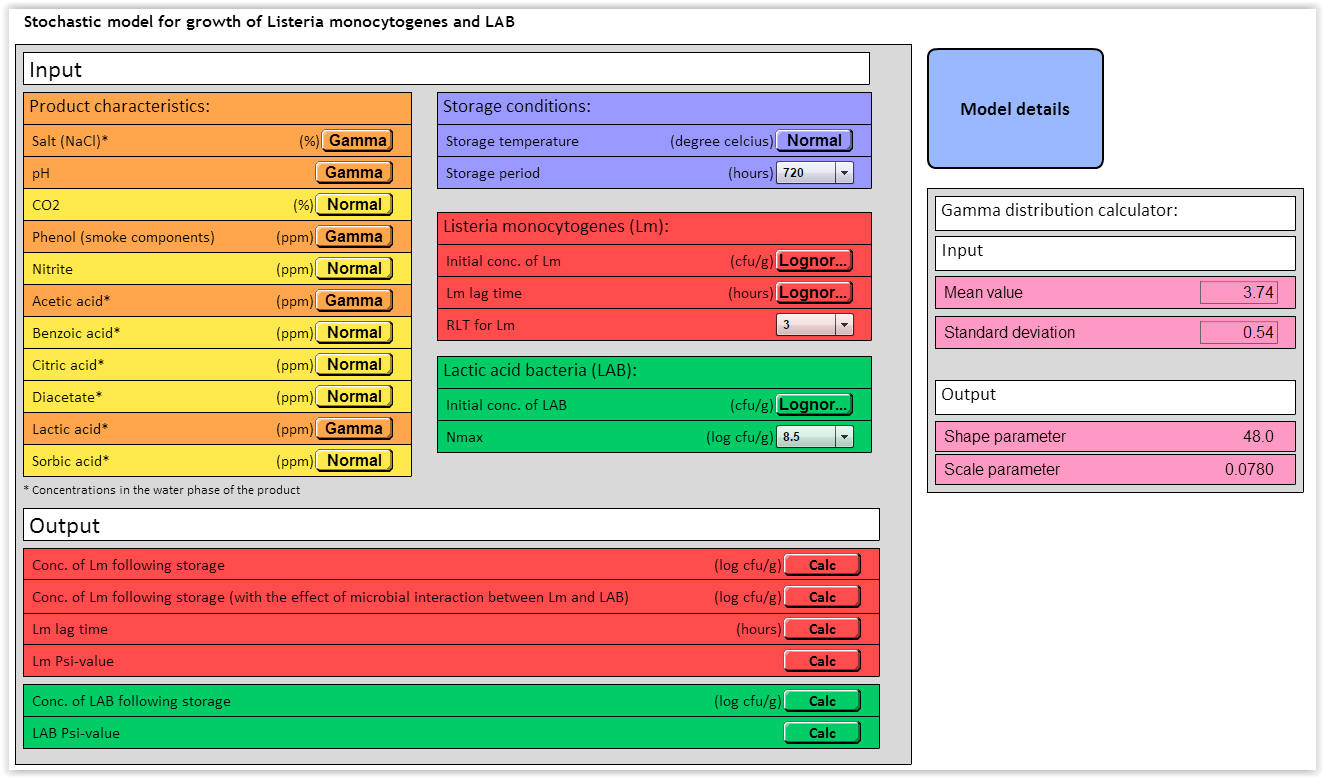 |
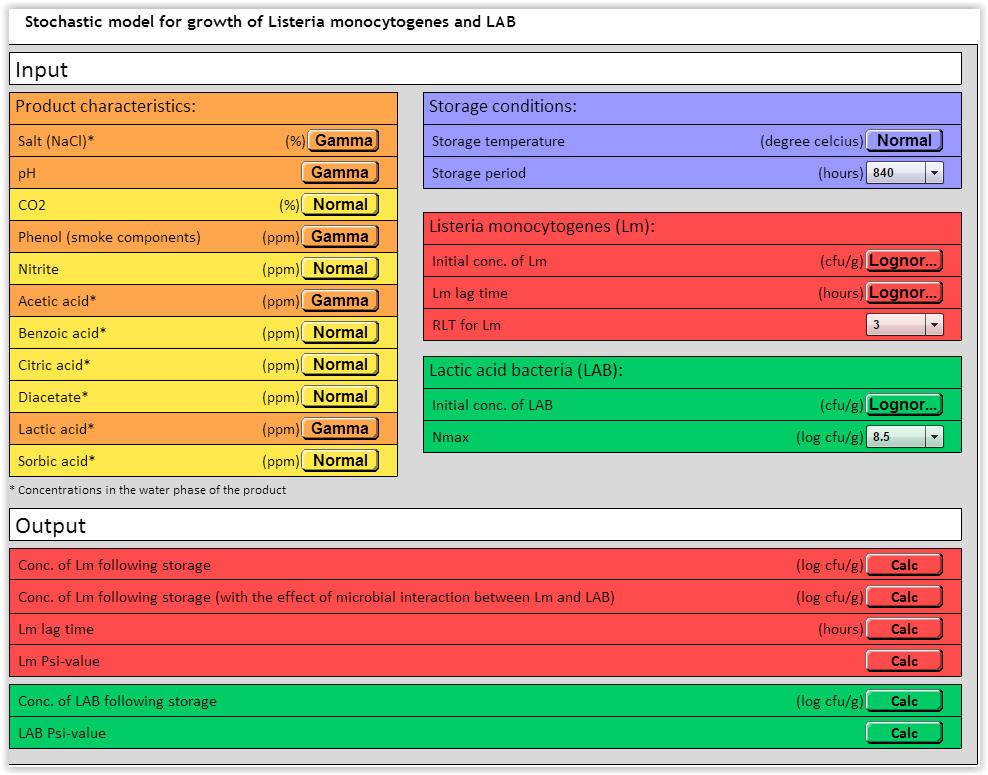
| Fig. 1. User interface for the stochastic LmLAB-model. |
Input variables:
The stochastic LmLAB-model includes different input variables for product characteristics, storage conditions, Listeria monocytogenes (Lm) and lactic acid bacteria (LAB) (Fig. 1). Of the 12 environmental parameters, the performance of the stochastic LmLAB model has been successfully validated for the effect of temperature, salt (NaCl), pH, phenol, acetic acid and lactic acid (Mejlholm et al. 2014).
Product characteristics and storage conditions
 |
| Equation 1. Calculation of shape and scale parameters to be used as input for gamma distributions. |
Table 1. Default settings for product characteristics and storage conditions included in the stochastic LmLAB-model.
|
Product
characteristics and storage conditions |
Mean value | Standard deviation | Distribution |
| Salt (NaCl) (%)a | 3.74 | 0.54 | Gamma (48.0, 0.0780)b |
| pH | 6.11 | 0.07 | Gamma (7620, 0.000802)b |
| CO2 (%) | 0 | 0 | Normal (0, 0)c |
| Phenol (smoke components) (ppm) | 8.8 | 2.2 | Gamma (16.0, 0.550)b |
| Nitrite (ppm) | 0 | 0 | Normal (0, 0)c |
| Acetic acid (ppm)a | 1979 | 752 | Gamma (6.93, 286)b |
| Benzoic acid (ppm)a | 0 | 0 | Normal (0, 0)c |
| Citric acid (ppm)a | 0 | 0 | Normal (0, 0)c |
| Diacetate (ppm)a | 0 | 0 | Normal (0, 0)c |
| Lactic acid (ppm)a | 8749 | 1416 | Gamma (38.2, 229)b |
| Sorbic acid (ppm)a | 0 | 0 | Normal (0, 0)c |
| Storage temperature ( °C) | 5.0 | 1.0 | Normal (5.0, 1.0)c |
a In the water phase of the product
b Gamma distribution with shape parameter α and scale parameter β
c Normal distribution with mean value and standard deviation
 |
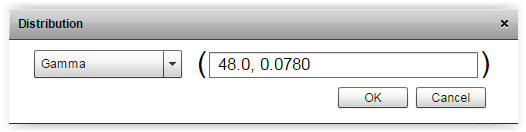 |
| Fig. 2. By pressing the gamma button it is possible to enter shape and scale parameters. The chosen distribution can also be changed e.g. from gamma to normal. | |
  |
|
| Fig. 3. Gamma distributions for pH and phenol in cold-smoked and marinated salmon (n = 56). |
Listeria monocytogenes (Lm)
Initial conc. of Lm (cfu/g): The initial cell concentration of L. monocytogenes is assumed to follow a log-normal distribution. As default a mean value of 1 cfu/g and a standard deviation of 0 cfu/g is used for the initial cell concentration of L. monocytogenes.
Lm lag time (hours): The lag time for L. monocytogenes is assumed to follow a log-normal distribution. As default a mean value of 0 hours and a standard deviation of 0 hours is used corresponding to no lag time for L. monocytogenes. To include the lag time, input values should be obtained from the output section of the model by using the following procedure: Enter the relevant product characteristics and storage conditions into the input section of the model → go to the output section and press Calc. for "Lm lag time" → enter the calculated values for the lag time (mean value and standard deviation) into "Lm lag time" of the input section of the model. Now the model includes the lag time for L. monocytogenes when "Conc. of Lm following storage" and "Conc. of Lm following storage (with the effect of microbial interaction between Lm and LAB) are predicted.
RLT for Lm: The lag time for L. monocytogenes is calculated using the relative lag time (RLT) concept (Eqn. 2). Based on our results we recommend that a RLT of 3.0 (default value) is used for naturally contaminated samples of cold-smoked and marinated fish products (Mejlholm et al., 2014). The desired RLT can be chosen from the drop-down menu (1.5, 3.0, 4.5 or 6.0).
 |
| Equation 2. Calculation of lag time using the relative lag time (RLT) concept. |
Lactic acid bacteria (LAB)
Output variables:
The stochastic LmLAB-model includes different output variables for L. monocytogenes (Lm) and lactic acid bacteria (LAB) (Fig. 1). To run the simulations the calc button besides each of the outputs should be pressed. For each simulation 10.000 Monte-Carlo repetitions are carried out.
Importantly: Number formats ending with 'm' or 'u' should be interpreted as 10-3 or 10-6 (Example: 7.5m = 7.5 * 10-3 and 7.5u = 7.5 * 10-6)
Example on how to use the stochastic LmLAB-model:
Input variables: Storage period → 840 hours, RLT for Lm → 3 and Nmax → 8.5 log (cfu/g) (Fig. 4). Other input variables see Table 2
Table 2. Input variables for example
| Input variables | Mean ± std.dev | Shape parameter (α)a | Scale parameter (β)b |
| Salt (NaCl) (%) | 3.0 ± 0.5 | 36 | 0.0833 |
| pH | 6.1 ± 0.1 | 3720 | 0.0016 |
| Phenol (smoke components) (ppm) | 8.0 ± 3.0 | 7.11 | 1.13 |
| Acetic acid (ppm) | 2000 ± 500 | 16 | 125 |
| Lactic acid (ppm) | 8000 ± 1000 | 64 | 125 |
| Storage temperature (°C) | 6.0 ± 1.0 | - | - |
| Initial conc. of Lm (cfu/g) | 1 ± 0 | - | - |
| Lm lag time (hours) | To be calculated (See 2. and 3.) | ||
| Initial conc. of LAB (cfu/g) | 10 ± 0 | - | - |
a Calculated using the Gamma distribution calculator of the stochastic LmLAB-model (See Fig. 1)
 |
| Fig. 4. Stochastic LmLAB-model with input variables (See Table 2 for details). |
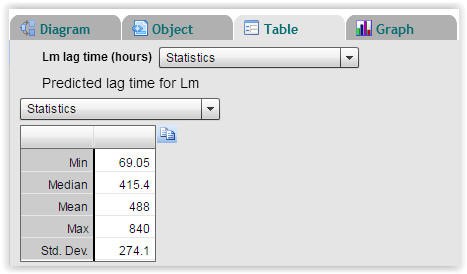 |
| Fig. 5. Statistics on calculated lag times of Listeria monocytogenes (Select "Table" → "Statistics"). |
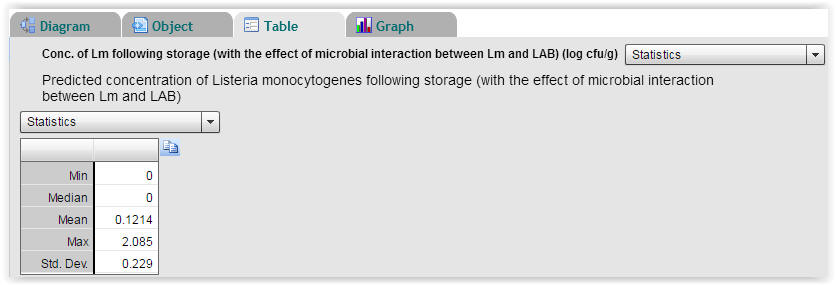 |
| Fig. 6. Statistics on predicted concentrations of Listeria monocytogenes following storage. With an initial cell concentration of 0 log (cfu/g) for Listeria monocytogenes the highest predicted cell concentration following storage is 2.085 log (cfu/g) and the mean value is 0.1214 log (cfu/g) (Select "Table" → "Statistics"). |
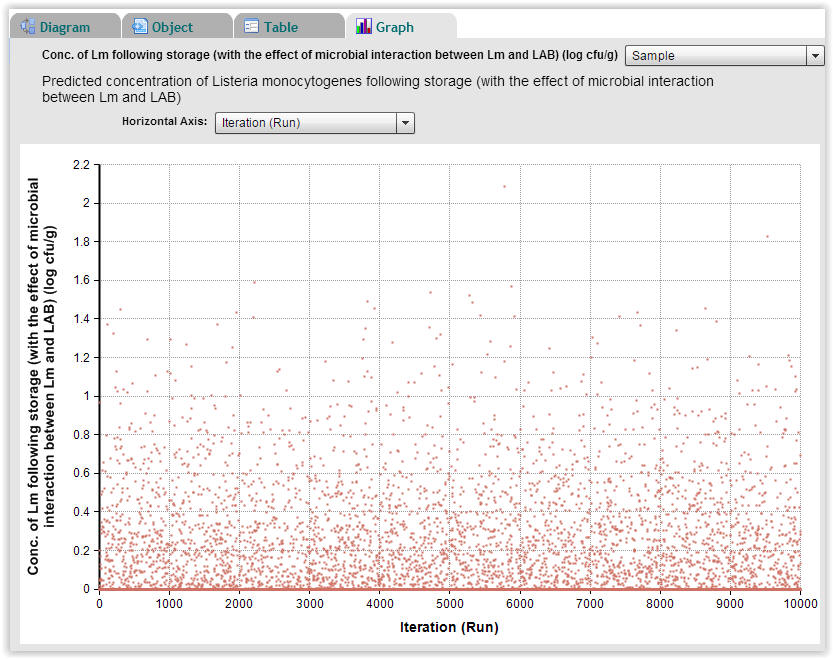 |
| Fig. 7. Predicted concentration of Listeria monocytogenes following storage for each of the 10.000 Monte-Carlo repetitions (Select "Graph" → "Sample"). |
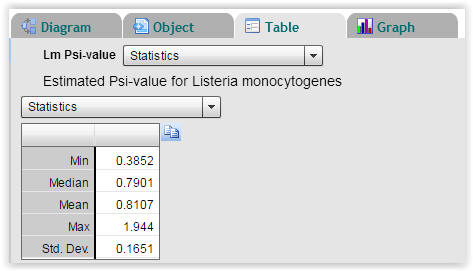 |
| Fig. 8. Statistics on calculated Psi-values for Listeria monocytogenes (Select "Table" → "Statistics"). |
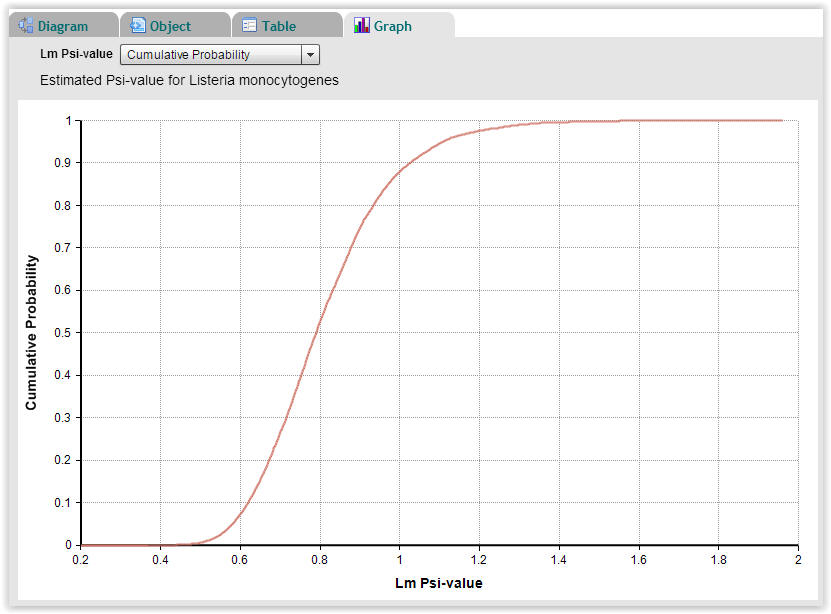 |
| Fig. 9. Cumulative probability plot of Psi-values for Listeria monocytogenes showing that approximately 12% of the 10.000 Monte-Carlo repetitions have a Psi-value higher than 1.0 (Select "Graph" → "Cumulative Probability"). |
References
Mejlholm, O., Bøknæs, N. and Dalgaard, P.
(2014). Development and evaluation of a stochastic model for potential
growth of Listeria monocytogenes in naturally contaminated
lightly preserved seafood. Food Microbiol.
http://dx.doi.org/10.1016/j.fm.2014.06.006
Mejlholm, O. and Dalgaard, P. (2015). Modelling the simultaneous growth
of Listeria monocytogenes and lactic acid bacteria in seafood
and mayonnaise-based seafood salads. Food Microbiol. 46,
1-14.
Mejlholm, O. and Dalgaard, P. (2007b). Modeling and predicting the
growth of lactic acid bacteria in lightly preserved seafood and their
inhibiting effect on Listeria monocytogenes. J. Food Prot.
70 (11), 2485-2497.
Mejlholm, O. and Dalgaard, P. (2009). Development and validation of an
extensive growth and growth boundary model for Listeria
monocytogenes in lightly preserved and ready-to-eat shrimp. J.
Food Prot. 72 (10), 2132-2143.
Mejlholm, O. and Dalgaard, P. (2013). Development and validation of an
extensive growth and growth boundary model for psychrotolerant
Lactobacillus spp. in seafood and meat products. Int. J. Food
Microbiol. 167 (2), 244-260.
Giménez, B. and Dalgaard, P. (2004). Modelling and predicting the
simultaneous growth of Listeria monocytogenes and spoilage
micro-organisms in cold-smoked salmon. J. Appl. Microbiol.
96 (1), 96-109.
Le Marc, Y., Huchet, V., Bourgeois, C. M., Guyonnet, J. P., Mafart, P.
and Thuault, D. (2002). Modelling the growth kinetics of Listeria
as a function of temperature, pH and organic acid concentration.
Int. J. Food Microbiol. 73, 219-237.