|
|
| Model | Photobacterium phosphoreum: Microbial spoilage model for fresh MAP fish |
| Reference | Dalgaard, P., Mejlholm, O. and Huss, H.H. (1997a). Application of an iterative approach for development of a microbial model predicting the shelf-life of packed fish. Int. J. Food Microbiol. 38, 169-179 |
| Primary growth model | Log-transformed 3-parameter Logistic model |
| Secondary growth model | Polynomial model (quadratic) and square-root model |
| Factor(s) in model | Temperature and %CO2 |
| Product validation studies |
|
| Range of applicability |
|
| Photobacterium phosphoreum is the specific spoilage organism (SSO) that limits shelf-life of fresh marine fish when stored in modified atmosphere packaging (MAP). P. photobacterium typically grows without a lag phase and the log-transformed 3-parameter Logistic model (Eqn. 1) is appropriate as a primary growth model. |
| Primary growth model: |
|
|
| In eqn. 1, Nt (cfu/g) is the concentration of P. phosphoreum at time t, N0 (cfu/g) the initial concentration of P. phosphoreum, Nmax the maximum concentration (cfu/g) and mmax the maximum specific growth rate (h -1). |
 |
| Figure 1. Log-transformed Logistic model fitted to data for growth of P. phosphoreum in naturally contaminated cod fillets stored at 0oC in an atmosphere with 100% N2. As indicated by the arrows, sensory spoilage was observed some time after P. phosphoreum reached its maximum cell concentration (Dalgaard et al. 1997a) |
| The end of shelf-life for MAP cod fillets has been observed four generation times (tgen = Ln(2)/µmax) after the inflection point (ti) of the Logistic growth model (See Figure above). Consequently, a particular minimal spoilage level was not identified. However, the inflection point is the time when Nt is equal to Nmax/2 and shelf- life can be calculated by the shelf-life criterion shown below (Eqn. 2): |
|
|
Shelf-life is calculated from the initial concentration of P. phosphoreum and from its maximum specific growth rate (mmax). The initial numbers of P. phosphoreum can be determined in fresh fish by a specific conductance based method (Dalgaard et al., 1996) or by a quantitative real-time PCR (qPCR) method (Macé et al 2013).
|
Eqn. 4 |
 |
| Figure 2. Observed and predicted growth of Photobacterium phosphoreum in fresh MAP cod fillets (Dalgaard et al. 1997a) |
| The effect of temperature and CO2 on the maximum specific growth rate (mmax) of P. phosphoreum in MAP cod fillets can be predicted by a quadratic polynomial model (Eqn. 3). A square-root model (Eqn. 4) is used for MAP plaice and MAP salmon. These secondary models allow growth of P. phosphoreum to be predicted in fresh fish stored in modified atmospheres with CO2/N2 gas mixtures. See e.g. the Figure above for growth of P. phosphoreum in fresh MAP cod fillets. In fact, observed and predicted mmax-values from 11 storage trials with MAP cod resulted in bias- and accuracy factor values of 0.98 and 1.19, respectively, and this shows that the model predicted growth rates accurately (Dalgaard, 1999). In addition, in product storage trials the model only underestimated shelf-life by 9% on average (See Table just below). |
Observed and predicted shelf-life of MAP cod fillets stored at constant and at varying temperatures
| Initial storage temp. | 0oC |
0oC |
0oC |
5oC |
| Final storage temp. | 0oC |
5oC |
10oC |
0oC |
| Winter experiments | ||||
| Observed shelf-life, days | 15.8 |
8.2 |
6.4 |
9.3 |
| Predicted shelf-life, days | 13.9 (-12 %)a |
8.1 (- 2 %) |
6..1 (- 4 %) |
8.5 (- 9 %) |
| Summer experiments | ||||
| Observed shelf-life, days | 16.8 |
9.2 |
5.9 |
11.8 |
| Predicted shelf-life, days | 14.7 (-13 %) |
8.0 (-13 %) |
5.4 (- 8 %) |
10.3 (-13 %) |
a
% deviation between observed and predicted shelf-life
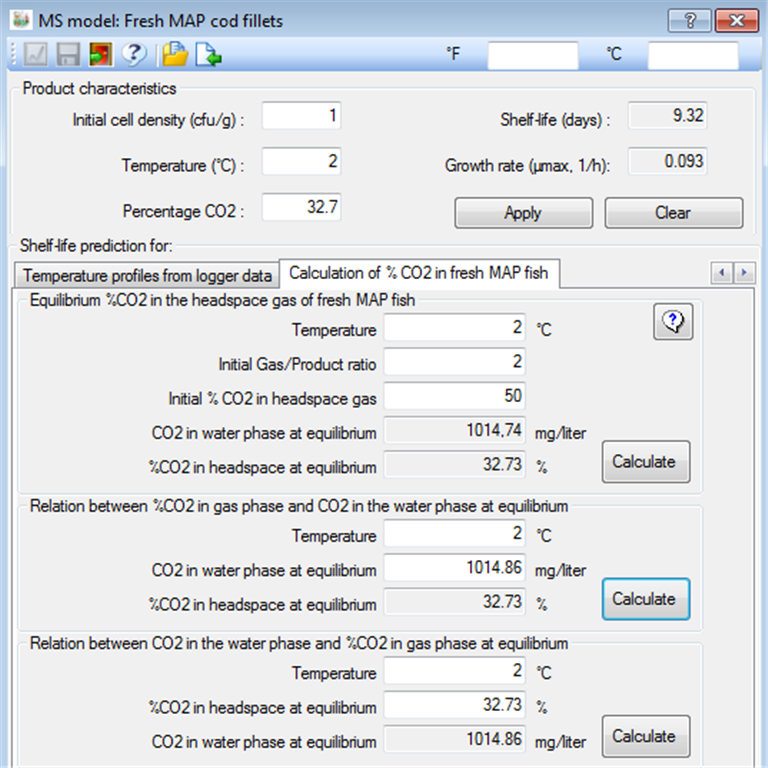
Effect of MAP on Photobacterium phosphoreumIt is important to use the equilibrium concentration of CO2 when predicting the effect of MAP on the maximum specific growth rate (mmax) of microorganisms. As an example cod fillets packed with an initial CO2 concentration of 60% and a gas/fish ratio of 2:1 (i.e. 200 ml gas and 100 g of fish) will have an equilibrium concentration of close to 40% CO2 because CO2 is dissolved in the fish flesh. With the same initial CO2 concentration but a gas/fish ratio of 4:1 (i.e. 400 ml gas and 100 g of fish) the equilibrium concentration of CO2 will be close to 50% CO2. To allow users of FSSP to conveniently calculate equilibrium concentrations of CO2 in fresh MAP fish a specific module has been included in the software (See the FSSP dialog box below). FSSP calculates equilibrium concentrations of CO2 as a function of storage temperature, initial gas/product ratio and initial concentration of CO2 in the headspace gas (Ross and Dalgaard 2004 page 129-131). Follow this link for further details on equations used to calculation equilibrium concentrations of CO2. |
 |
Effect of gas mixtures with high conncentrations of both CO2 and O2Oxygen reduces the growth rate of Photobacterium phosphoreum compared to atmospheres without oxygen (Dalgaard, 1993, Guldager et al. 1998). Furthermore, it has been shown that growth of Photobacterium phosphoreum can be markedly reduced by packaging of food in atmospheres with high concentration of both CO2 and 02. This has been observed e.g. for farmed MAP cod, farmed MAP halibut, and MAP tuna (Emborg et al. 2005, Hansen et al. 2007, Hovda et al. 2007, Sivertsvik, 2007). However, this marked effect has not been observed in all studies with high concentration of both CO2 and O2 (Dalgaard et al. 1997b). For captured/wild fresh MAP cod fillets, shelf-life at 2°C was extended by 1-2 days when 20% of the nitrogen in MAP was replaced by 20% pure oxygen (Guldager et al., 1998). The effect of atmospheres with high concentration of both CO2 and O2 has not yet been included in the FSSP software. Consequently, FSSP may underestimate the shelf-life of fresh MAP fish stored in gas mixtures containing high concentrations of oxygen together with high concentrations of CO2. |
 Eqn. 1
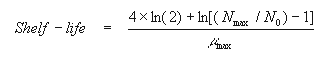 Eqn.
2
Eqn.
2