|
|
| Module | Comparison
of observed and predicted shelf-life data |
| References | Dalgaard,
P. 2002 . Modelling and predicting the shelf-life of seafood. Chapter 12
in Safety and Quality Issues in Fish Processing. Bremner, H.A.
(ed). Woodhead Publishing Ltd. pp.191-219 and
Dalgaard, P, Murillo, E.I. and Jřrgensen, L.V. 2004. Modelling the effect of temperature on shelf-life and on the interaction between the spoilage microflora and Listeria monocytogenes in cold-smoked salmon. Chapter 22 In: Shahidi, F. and Simpson, B. K. (eds), Seafood Quality and Safety. Advances in the New Millennium. ScienceTech Publishing Company, St. John’s, Newfoundland, Canada, 281-302.
|
| Factor(s) in model | Temperature |
|
This module of FSSP allows shelf-life data obtained at different temperatures to be quantitatively compared with the Arrhenius, Exponential or Square-root spoilage models when used with known temperature characteristics. Thus, users can compare their own data with existing RRS-models in FSSP or evaluate if the Arrhenius, Exponential or Square-root spoilage models will be appropriate for their shelf-life data if these models are used with different temperature characteristics. Shelf-life data can be entered manually into FSSP. Alternatively
data can be entered using the FSSP raw data importer ( |
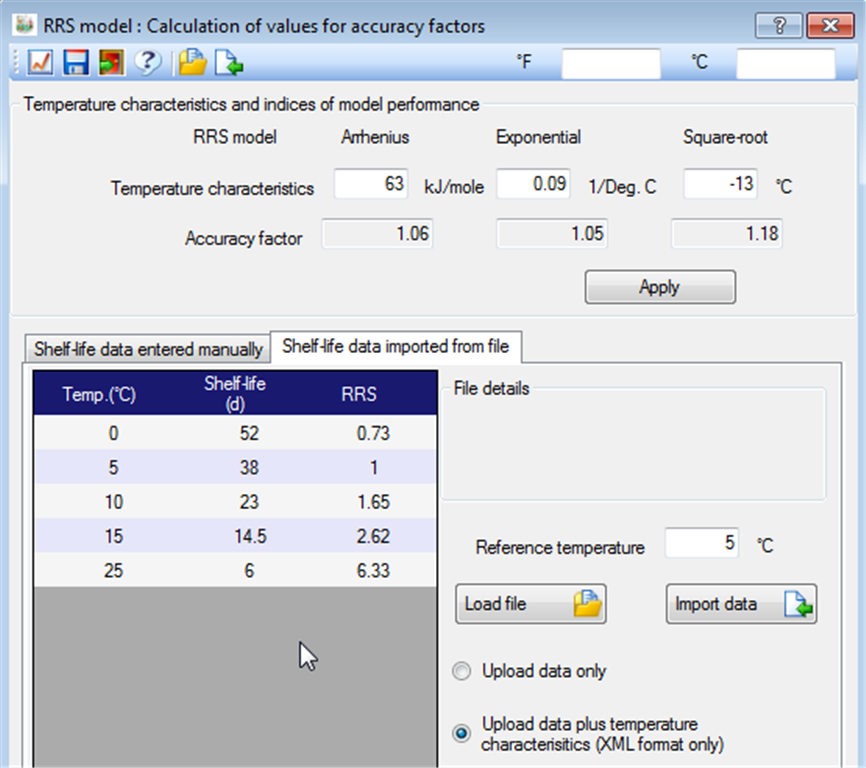 |
| FSSP uses relative rates of spoilage (RRS) to compare observed and predicted shelf-life data. The comparison rely on calculation of accuracy-factor values as well as presentation of observed and predicted data in graphs (See Eqn. 1 and the FSSP output window below). |
|
|
| The accuracy-factor was originally suggested by Ross (1996) to compare observed and predicted growth rates of bacteria but can also be used for RRS-data (Dalgaard et al. 2004). When accuracy-factors values are calculated from RRS-data the reference temperature used to calculate RRS influence the results. Therefore, FSSP determines average accuracy-factors only. These average accuracy-factor values are determined from the RRS data by using all tested storage temperatures as the reference temperature. When observed and predicted RRS-data are identical the accuracy-factor has a value of 1.00 and when the observed and predicted RRS-values differ the accuracy-factor values become larger than one. An upper accuracy-factor value for successful validation of RRS models has not yet been established but values above ~1.3 indicate substantial deviation between observed and predicted RRS-values. Accuracy-factor values for the Exponential, the Arrhenius and the Square-root spoilage models can be used together with graphs (See Figure below) to select the more appropriate RRS model(s) for a given set of shelf-life data. |
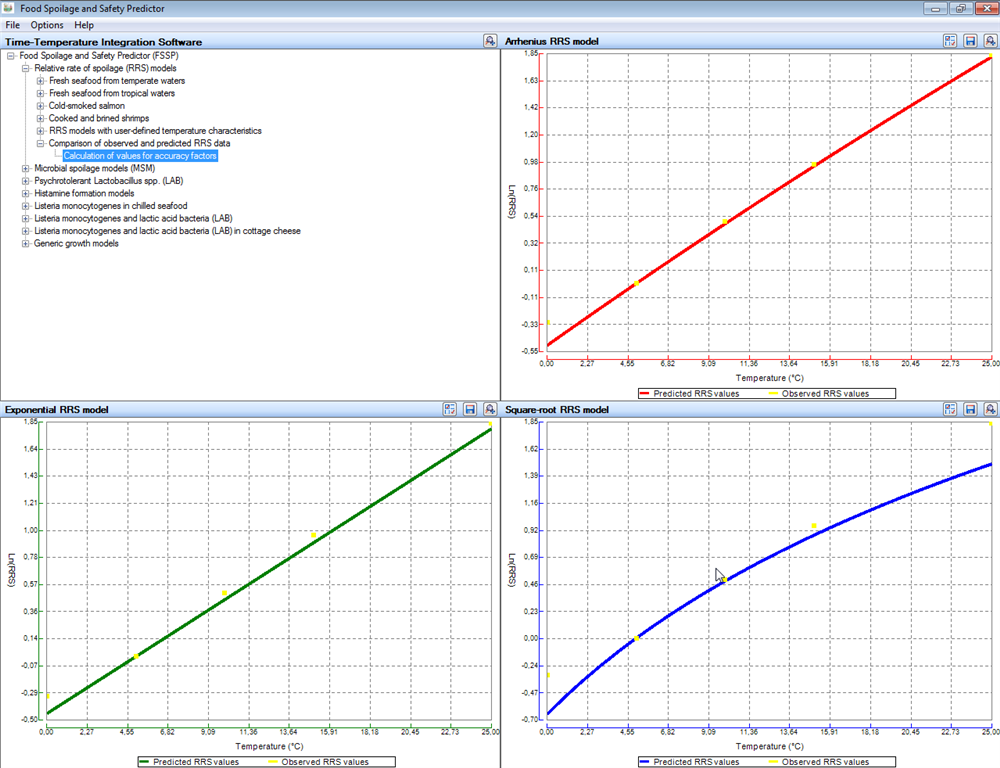 |