|
|
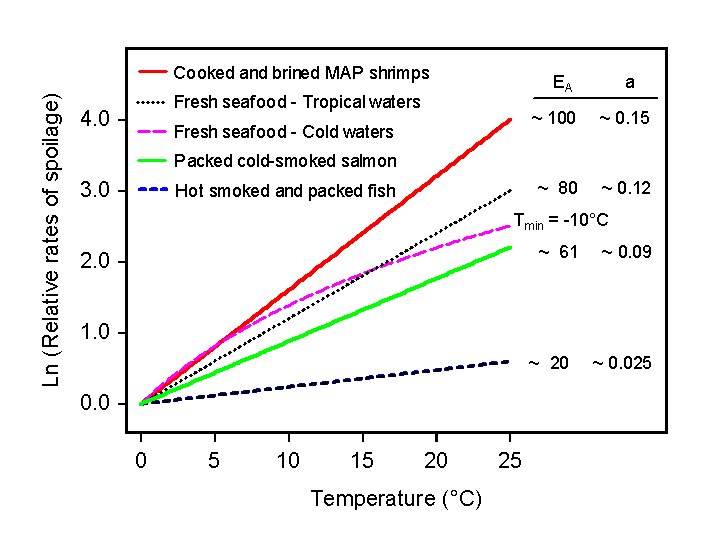
Introduction to relative rate of spoilage (RRS) modelsMathematical RRS models are developed on the basis of shelf-life data obtained at different storage temperatures in experiments where shelf-life was determined by sensory evaluation. These models do not take into account the types of reactions that cause spoilage at different temperatures and this is an advantage in the sense that RRS models can be valid for a wide range of storage temperatures. RRS-models are very simple but still most useful for calculation of shelf-life at different storage temperatures. To predict shelf-life at different temperatures the user only needs to provide the product shelf-life for a single known and constant storage temperature. The RRS models then allow shelf-life to be predicted at different temperatures. For fresh food, the relative rate of spoilage (RRS) at t°C has been defined as the shelf-life at 0°C divided by the shelf-life at t°C (See Dalgaard 2002). Thus, 0°C is used as a reference temperature for fresh fish but it can be appropriate to use different reference temperatures e.g. 5°C for lightly preserved foods. Early studies with fresh fish from temperate waters have shown the effect of different combinations of the time and temperature on shelf-life to be additive (Charm et al., 1972; McMeekin et al., 1988). More recently, this was confirmed with vacuum-packed cold-smoked salmon (Dalgaard et al. 2004) and FSSP uses the concept of additive effects when time-temperature integration relying on RRS-models is carried out. The effect of temperature on RRS differs markedly between groups of foods as shown in Fig. 1. Consequently, different RRS-models are required to evaluate the effect of temperature during storage of various foods. Therefore, FSSP includes models for (i) fresh foods, (ii) lightly preserved foods and (iii) models with user defined-parameter values that can be applied for any type of food. |
|
|
|
Figure 1. Effect of temperature on the relative rates of spoilage for different types of seafoods. Modified from Dalgaard (2003) with permission from Elsevier Ltd. |
|
Types of RRS-models
|
|
|
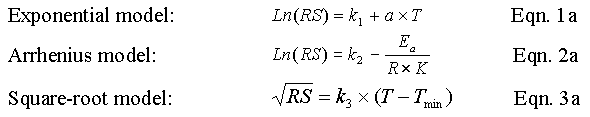
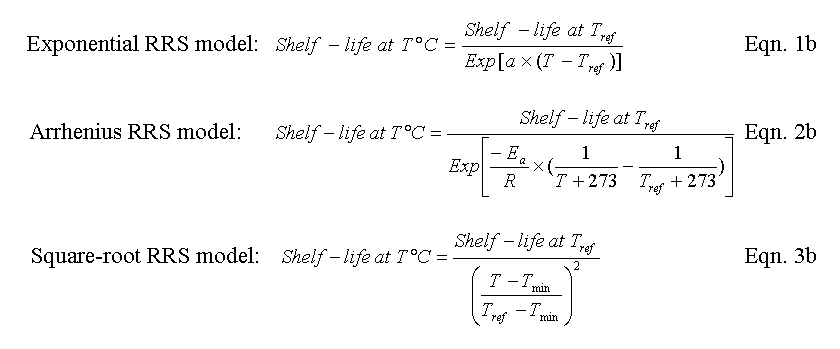
| In Eqn. 1, 2 and 3 T is temperature in °C, K is temperature in Kelvin, R is the gas constant 8.31 (J mol-1 K-1), k1, k2. and k3 are constants. a, Ea and Tmin are the temperature characteristics in the three models, respectively. After estimation of temperature characteristics with eqn. 1a, 2a and 3a shelf-life can be predicted at different temperatures using Eqn. 1b, 2b and 3b. |
|
|
Product validationRRS models are developed on the basis of shelf-life data obtained directly from storage trials with naturally contaminated foods. Consequently, validation of RRS-models is different from product validation of microbial spoilage models developed from growth of specific microorganisms in laboratory media (See MS models). Validation of RRS-models consist in determining whether existing RRS-models are appropriate for a given set of shelf-life data (or if a new model needs to be developed). To compare observed and predicted RRS data, FSSP uses the accuracy factor (eqn. 4) and graphical comparison of data (See Using FSSP under Comparison of observed and predicted RRS data )
|
|
|